Measuring Employee Advocacy Without Vanity Metrics
Many organizations struggle to measure employee advocacy effectively. This post teaches you how to design a simple measurement plan to tie employee actions to meaningful business results, avoiding surface-level vanity metrics.

Measuring Employee Advocacy Without Vanity Metrics
But tracking the effectiveness of employee advocacy? That’s where I think most organizations fall short. It’s simple enough to start the program, but explaining what’s working and why and what would have happened anyway—and understanding what the business is actually getting in return for the time that your team is putting into it—that’s where a lot of SMBs will struggle, especially if they get pushback from senior leaders on “What did this move that wouldn’t have moved otherwise and what’s the actual return on investment for the time my team is putting in?”
In this post, I’m going to teach you how to measure employee advocacy in a way that really stands up to analysis. I’m going to walk you through how I filter out the noise, tie employee actions to meaningful results like qualified discussions, leads, pipeline contribution, and talent pipeline progress, and add in the value that won’t be captured by click data, like screenshots, shares of posts, DMs, and mentions on sales calls. You’ll get out of it a simple measurement plan that you can quickly apply even without a robust analytics team, and a solid way to report results without relying on surface-level vanity metrics.
If you’re building the operating rhythm around this, a weekly social media system can help make measurement easier because it creates consistent inputs.
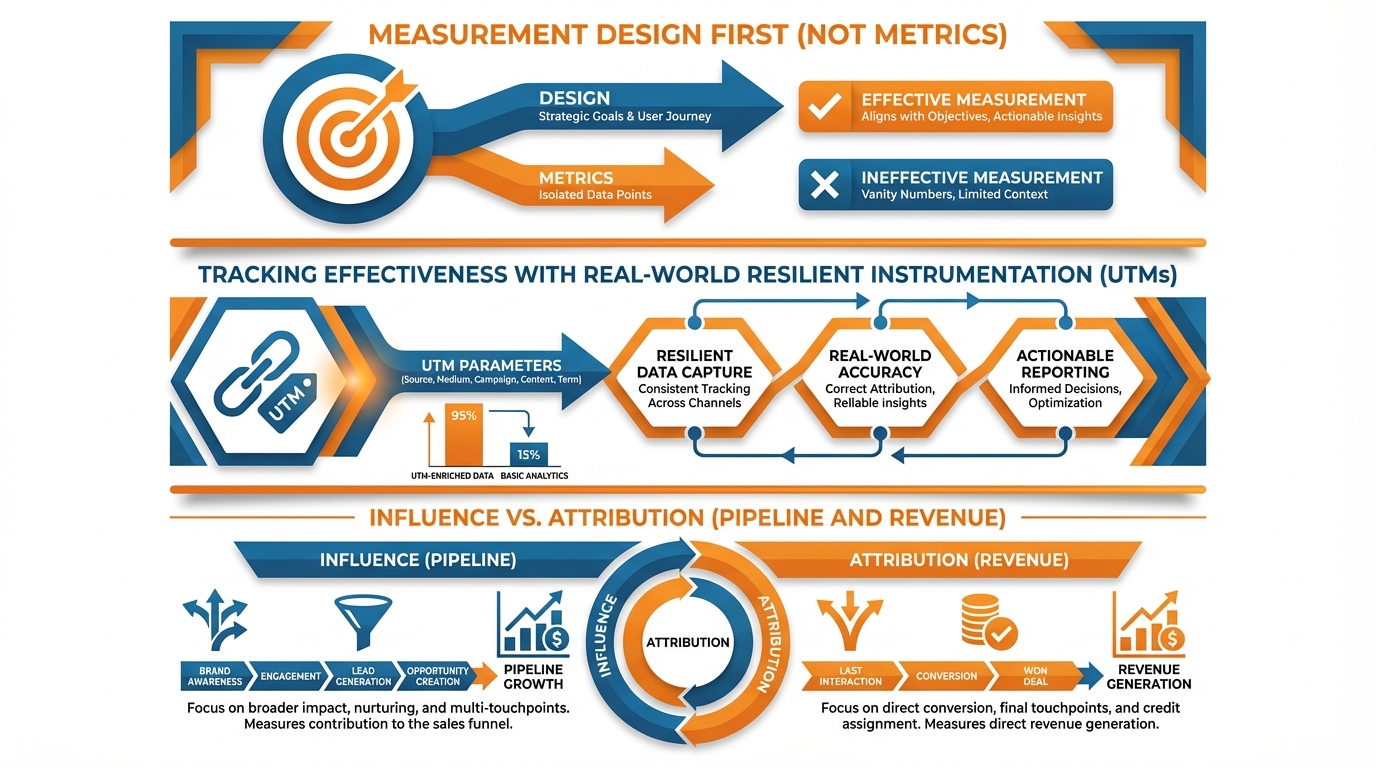
Measurement design first (not metrics)
When it comes to measuring employee advocacy, the focus should be on measurement design first (not metrics). The most important thing to know about measuring employee advocacy is that it becomes dramatically easier once you abandon the idea of a “dashboard” and instead approach it like you’re crafting a mini experiment.
This means that you must first define what “success” means for your business right now.
Employee advocacy can be used to support multiple different objectives, such as to:
- drive B2B pipeline
- bolster employer brand
- grow PR and share of voice
- develop customer trust that removes friction from the sales process
If you fail to choose a primary use case, you will end up with an overwhelming array of data that is very hard to evaluate in light of the only question leadership wants answered: what changed because our employees kept showing up?
Once you have identified that, you actually define your metrics in two ways: first you want to understand that there’s movement, such as: are the lights blinking when I turn the key in the ignition?
Those would be what I would call leading indicators like: Are advocates sharing? How often are they posting? Are your target buyers actually engaging with those posts? Are they commenting on them? Are they viewing employee profiles that are in the programme? Are they reaching out to them in a DM? Are they mentioning them in a post that they are a part of.
Then you have lagging indicators, that demonstrate that it’s driving business value: number of sales conversations that were influenced by a post that an employee shared. Number of opportunities that were created that had employee advocacy as a touchpoint on the buyer journey. Number of candidates referred to the firm. Number of offers accepted by those candidates. Number of renewals that are at risk that don’t churn.
What I do is define what influence looks like before we start the programme so we don’t have to have that debate afterwards.
So if someone in the target market is engaging with a piece of content that an employee has shared. If they mention the content in a call to a salesperson. If they reply in a direct message to an employee and they go to a webpage that an employee shared then I count that as influence even if I can’t connect the dots on a last-click basis.
Then you establish some baselines to enable you to later speak to what shifted post launch.
You look back to a pre period of 4-8 weeks to pull some straightforward baselines for how many leads you get, how many calls mention social, how many applicants are applying because of social, and how much branded search volume you receive weekly.
I also create a fast baseline for the content, including average engagement per post type, number of genuine comments from decision makers, etc., because this stops you from trumpeting a spike that is actually just a seasonal fluctuation or a one-off piece of content going viral.
Last, you make the results defensible by comparing apples to apples and not just dumping everything into a single bucket called “advocacy.”
Look at pre- and post- comparisons, and wherever possible, set up a small control group that won’t participate for the first month so you can isolate baseline growth from the lift from advocacy.
Cohort your advocates by geography, function, tenure, or department, because a founder posting twice a week and a customer success rep posting twice a month are not the same distribution channel and shouldn’t be blended into a meaningless number.
This is where small companies can actually win: even with a tiny team, really tight cohorting and clean comparisons will take you a long way.
If you want to systematize the planning side that enables clean comparisons, a social media content calendar can make the baseline vs. lift story much easier to defend.
Tracking the effectiveness of employee advocacy with real-world resilient instrumentation
Here’s how you get your employee advocacy measurements going: UTMs that employees can use without messing up your reporting. If you need a consistent way to do this, using a UTM builder helps keep parameters standardized across the team.
You want one format so simple, consistent, and boring that it’s immune to copy-paste: source for the platform, medium for the channel type, and campaign for the program and time period.
This means you set utm_source=linkedin, utm_medium=employee, utm_campaign=advocacy_2026q1 and you only add utm_content when you need some variability (e.g. founder_post vs cs_post).
I wouldn’t put employee names in UTMs as it introduces both privacy and string-messiness issues (that employees will edit) and multiplies your analytics into hundreds of near-duplicate variants.
If you need segmentation, you do it one level higher in your routing, not in the URL shared by your team.
Second, make sure the link is not painful, because if you’re tracking by having employees copy-paste full URLs you’ll get to week 2 and it will fall apart.
You can send all of it through shortened URLs, or a link hub for each campaign where employees share one link and you keep the UTM in there.
If I set this up I’ll also include a standard redirect rule so that every time the link is clicked they end up at the same canonical URL with the UTM, so you don’t end up with one person sharing the homepage, and another sharing a blog post with additional parameters, and your conversions spread across 5 landing pages.
The tactical benefit to this for a small business is you also can control editing: if something changes on the page, you change the redirect and all the shares that have been shared still work, and your tracking isn’t destroyed every time you update your website.
Next you integrate advocacy to your analytics and CRM so that it doesn’t get double-counted with paid or brand or partner traffic.
On the analytics side you decide whether it is a medium in its own right or rolls up into other mediums, but however you do it you make sure to decide going in so it doesn’t show up as a medium like social or referral.
On the CRM side you set up a single campaign or source bucket for employee advocacy and decide a rule like first touch gets source and any later get influence, so a deal that clicked an ad then clicked a post doesn’t show up as 2 sourced deals.
I also like to add one single simple field to get self-reported influence, like “saw post” or “spoke with employee,” because dark social is a thing and you will undercount without this, especially in B2B where buyers often lurk and look without clicking, and then mention it on calls.
You need governance to ensure that measuring the impact of employee advocacy is sustainable, in particular in a small business where trust is key.
Your default should be that you track aggregate cohort reporting (e.g. by department, job category, region) and individual reporting only where somebody is opted in to coaching or you are debugging a broken link.
I am dead set against tracking private messaging, scraping personal contacts, and publicly stacking employees up against each other based on their performance, because then participation becomes surveillance and your most valuable advocates will simply stop posting.
The measurable program is the one that people like to take part in, so you set expectations in writing: what is tracked, why, how long is it retained for, and how it will be used to optimise content and the funnel, not to police individual people.
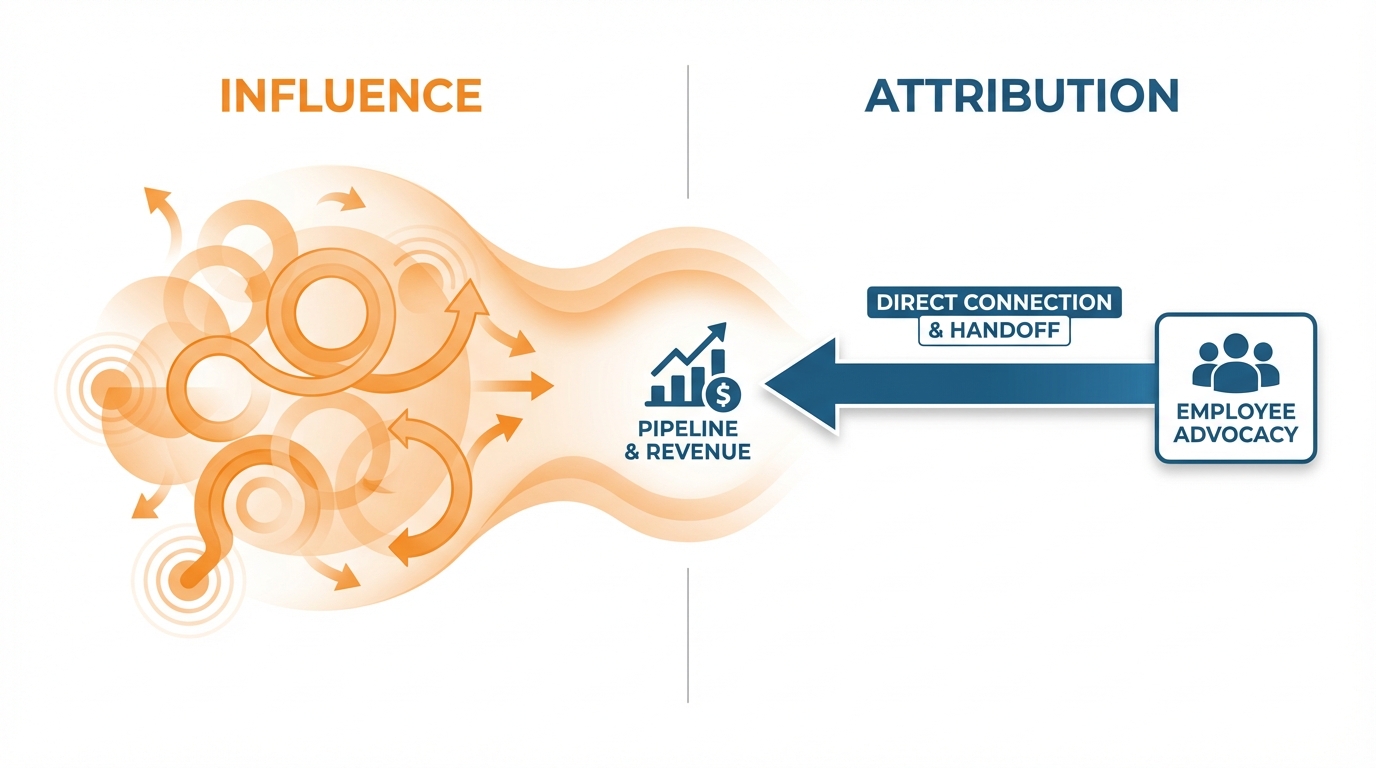
Influence vs. attribution (pipeline and revenue)
Understanding how to measure the effect of employee advocacy on both pipeline and revenue is a question I get asked a lot.
It’s an influence vs. attribution game!
Once you understand the difference between attributed and influenced, it’s easy to measure the value of employee advocacy.
I define attributed as a clean handoff: someone clicks on a link shared by an employee (with a UTM code, of course!), comes to your website, and then becomes a lead that you know as it moves through the various stages in your CRM.
I define influenced as any behavior that you can measure which has a positive effect on accelerating or influencing revenue that does not involve someone clicking on a link: a target reads an employee’s post, later comes to your website through direct traffic or searching for your brand, references your content during a call, or was referred to your content via an employee during a conversation then enters your funnel via another source.
If you define these terms before you show them your data, you will have built trust with sales and finance.
Now instead of debating what attributed and influenced mean, you can point to month-over-month trending.
To bring this to life in a small business, you need three layers of evidence that tie into a single narrative: platform engagement (engagement from actual target accounts and roles, not overall likes, because 50 likes from peers is not equal to 5 likes from buyers), site behavior (behavior of visitors when they come from employee traffic versus other social traffic, with emphasis on behaviors that indicate pipeline such as pricing page visits, demo page views, product comparison reads, and > 1 page session), and CRM attribution (where advocacy is throughout the stages, for example lead > meeting booked, meeting booked > opportunity, opportunity > closed won, and the speed of those transitions).
When I have this down, employee-sourced traffic is typically lower in quantity but higher in quality, and you can demonstrate that through higher rates of conversion to sales conversation, and decreased time-to-next-stage for impacted opportunities.
Here’s where most teams shoot themselves in the foot by double-counting or attempting to force a single-touch story that nobody will believe.
The simple rule is that you leave one touch to claim source credit (usually first touch for source reporting), and you leave advocacy to earn influence credit if they show up later in the journey.
In practice, you implement this by linking your advocacy campaign to the contact and opportunity timeline as an influence touch, and then looking for patterns like when advocacy shows up before key moments in the deal, like reactivation after a point of silence, moving from evaluation to procurement, or spikes in stakeholder engagement.
If you want one number that finance will respect, track influenced pipeline (total value of all opps where advocacy shows up as a verified touchpoint), and track attributed pipeline (subset of influenced where advocacy is either the source or the direct last non-direct click), and report both (but not blended).
When the click isn’t enough, to make the influence claim stick, you set up a simple deal-level confirmation process sales can complete in less than a minute.
You add a simple field or picklist on the lead or opportunity for advocacy touchpoints such as saw employee post, engaged with employee, mentioned on call, introduced by employee, and then you require a quick update at two moments: after first meeting and at stage change to proposal.
You also map employee advocacy as its own campaign in your CRM so it can be attached consistently, and you encourage sales to paste concrete proof into the opportunity notes when available, like the buyer mentioning the post topic, a screenshot of a comment, or the name of the employee they follow.
That combination of timeline placement, campaign mapping, and confirmation turns employee advocacy from a loose brand activity into a quantifiable business tool, even when the buyer journey is invisible.
LinkedIn has shared examples showing this can scale: in a 2022 write-up on how employee sharing can massively expand reach, 123 pieces of content were shared 4,290 times, which increased aggregate reach by 15 million and drove 44,360 engagements.
Dark social: when the best results are off-site
How to track the effectiveness of employee advocacy when the best results are buried in dark social?
Employee advocacy measurement becomes complicated when the most valuable outcomes are driven off-site and outside your tracking parameters.
When your target prospect encounters an insightful post from one of your team members, they usually don’t follow the UTM-enabled link; they screenshot it and send it to someone on Slack or WhatsApp or through a DM—or they’re able to walk into a meeting with the information as if it’s a new idea they should be credited for.
That’s dark social.
And this is the measurement blind spot it inevitably creates: the conversions and signings you most need to attribute to advocacy are those that come in as direct traffic, a brand search, or with no traceable source.
The error is to imagine this is something you don’t need to account for; the win is building your measurement in a way that those invisible interactions still leave traceable footprints.
You start with self-reported attribution.
You get it in a structured way so you can analyze it, but you also make sure it’s so light that people actually fill it out.
You add a required “how did you hear about us” field to your high intent forms with a few controlled options: Employee post on LinkedIn; Employee mentioned this in a conversation; Forwarded to me in Slack or WhatsApp; plus one short free text field for what they do remember (the exact phrase).
You train sales to ask one question on calls: What made you reach out now? and to log the response as a picklist and one-line note.
In small businesses, this works surprisingly well because the volume is low: If you do 20-80 demos per month, one extra data point per call can quickly turn into a dataset you trust more than click attribution.
Immediately after the demo, I also send a micro-survey with two questions: What piece of content or messaging do you think persuaded you to reach out to us? How did you originally come across it?
Here’s where we drag dark social out of the shadows by gathering anecdotal evidence at scale instead of just an anecdote or two.
We’re looking for anything that repeats over time, like the same 2-3 anecdotes coming up every week even though the engagement was largely flat on the back-end.
If you find that a particular employee story keeps being referenced in comments like “read a post about the switching costs” or “your engineer broke down the migration risk,” you know that a narrative is driving sales even if you can’t track the clicks.
Lastly, you triangulate dark social attribution with intent signals that are difficult to fake.
You identify patterns, for example, that an increase in branded searches and pricing page visits occurs within 24-72 hours of a burst of employee shares, or that several employees from a target company hit your comparison and security pages following a viral internal thread.
You are not attempting to solve attribution 100%.
You are creating a four-part narrative through: Self-reported quantitative data Sales-qualified messaging influence Qualitative post-product demo activity Quantitative intent signals that tie to the employee narrative.
When all four stack up, you know you have generated demand from employee advocacy, even if dark social obscured the attribution of that exact click.
Trust context matters here too: the 2023 Edelman study summarized in a detailed report on trust at work was based on fieldwork dates July 20 - August 1, 2023 with 6,977 respondents across 7 countries, and the same research notes on higher expectations for “My Employer” credibility that “My Employer” was rated as 61% believable vs. 53% for mainstream media and 37% for social media.
O fim.
So, how do you track employee advocacy?
Well, it all comes down to establishing a credible framework: 1) that aligns with your program objectives, 2) measures effectiveness beyond soft metrics, and 3) delivers reliable, actionable insights.
If you want advocacy to be taken seriously in a small business, you have to make it boringly provable: Employee advocacy needs to be made sufficiently uninteresting for a small business to accept.
This means setting ahead of time what constitutes a referral, nailing down UTM conventions, and deciding how exactly employee advocacy will show up in analytics and your CRM, so that it never gets disputed or double-counted.
When you do this, you stop arguing about likes and start tracking business movement like This way, you can forget about likes and measure the business that advocacy actually drives: meetings generated, opportunities impacted, reduction in time-to-next-stage.
For it to be actionable, your program needs to be measured on a very small number of metrics that can be quickly digested by executives.
The leading indicator is activity and target-account engagement (engagement is NOT a leading indicator if the wrong people are engaging); if the wrong people are engaging, you are not generating pipeline.
The lagging indicators are pipeline metrics: pipeline value influenced by employees, pipeline value attributed to employees, and conversion of employee-generated traffic to high-intent indicators like demo requests and/or sequences of visits like our pricing page.
I have consistently seen employee-generated traffic to be lower in volume but significantly higher quality—often 2x to 5x better—than general social traffic when messaging is aligned to a real problem to be solved and the path is simple.
You also have to approach dark social as routine, not exceptional.
You’re never going to track 100 percent of the funnel through clicks, so you design stop points where invisible influence becomes tangible: a mandatory how-did-you-hear form field for high intent pages, a one-question sales entry habit post-first meeting, and a low-friction way to add advocacy as an influence touchpoint for opportunities.
You then validate that through patterns your business can touch, such as branded search spiking within 24 to 72 hours after a concentrated posting blast, or multiple stakeholders from the same target account visiting comparison and security pages following employee chatter around a specific concern.
Couple robust measurement design, reliable instrumentation, transparent impact and attribution standards, and reasonable dark-social management with real growth and that’s when measuring the impact of employee advocacy becomes a competitive advantage, not a reporting headache.
Your role is to keep the system simple enough to run it every month, strict enough to keep the data normalized, and close enough to pipeline and hiring performance to make concrete decisions with it.
That is when measuring the impact of employee advocacy becomes a competitive advantage, not a reporting headache.
If you want more ways to operationalize this, see smart social media automation and social media automation as supporting systems for consistency.
Financial outcomes can be material as well: a 2024 Financial Times piece on employee advocacy programs driving measurable earned media value cited a company (Simpli.fi) reporting nearly $90,000 in estimated earned media value from its employee advocacy programme and another company (Ivanti) reporting saving $500,000 in annual marketing costs.
Related reads
4/27/2026
B2B SaaS social media benchmarks: Set the right targets.
B2B SaaS social media benchmarks: Set the right targets. The trouble with defining B2B SaaS social media benchmarks is that it's an inherently impe...
4/25/2026
Building a personal brand as a technical founder (without becoming a creator)
Building a personal brand as a technical founder (without becoming a creator) Creating a personal brand as a tech founder should feel less about ma...
4/20/2026
Creative Post Ideas for Sustainable Brands (That Don’t Sound Greenwashy)
Creative Post Ideas for Sustainable Brands (That Don’t Sound Greenwashy) That’s not what creative post ideas for sustainable brands should look lik...