How to Calculate Engagement Rate Manually & Audit-Proof It
Discover the importance of manually calculating engagement rate for auditability and control over your social media metrics. Learn to define engagement and select the right denominator for consistent, defensible reporting that proves marketing effectiveness.

How to Calculate Engagement Rate Manually (and Make It Audit-Proof)
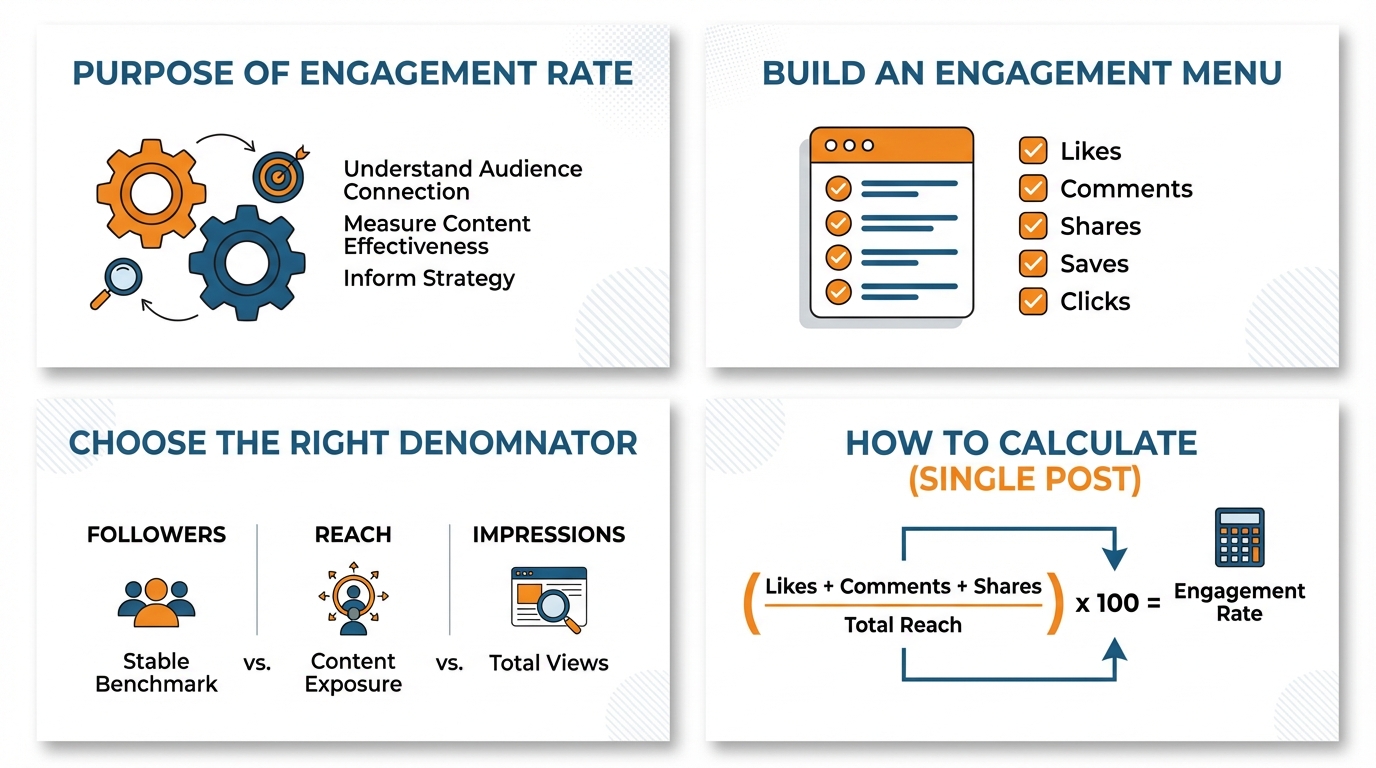
The purpose of engagement rate is to answer just one question: of the people who could have seen your post, how many actually did something with it? “Something” could be a like, a comment, a share, a save, a click, or even a reply, depending on the platform and your objective. Knowing how to calculate engagement rate manually is important because it provides auditability and control. You can tie every single number back to a post, maintain consistent reporting despite different dashboards displaying different totals, and stand by your numbers when a partner, client, or investor challenges your percentage calculation. For a small business, that authority is a must, not a want. It’s how you show your marketing efforts are effective without relying on ambiguous measurements. If you’re also building a repeatable reporting workflow, a social media audit can help you standardize what you track.
Here’s the thing: there isn’t just one agreed-upon official formula. Some people divide by followers. Some divide by reach or impressions. And some people don’t even agree on what engagement is. So the objective here isn’t to go find THE right formula. The objective is to pick a solid, defendable definition that aligns with what you are actually trying to measure. Then stick to it, and make sure you are applying it consistently so you are always comparing apples to apples. When you want a sanity check, you can compare your manual math against published benchmarks like Emplifi’s benchmark highlights, where TikTok reached a median engagement rate of 27.6% in Q4 2025 in their report on median engagement across platforms.
In this article, you will learn how to determine what counts as an engagement depending on the context, selecting the right denominator to make sure you’re not comparing apples to oranges, how I calculate it for a single post and then roll it up to a week or month, and the pitfalls that can make your engagement rate appear higher or lower than it actually is when comparing posts, platforms, or accounts.
If you want to calculate engagement rate yourself: you’ll first need to decide which interactions qualify as engagement.
Finally, before you start monkeying around with a formula, you’ll need to create an engagement menu for your business - the actual list of behaviors you’ll include as engagement on each platform.
Build an engagement menu (what “counts” as engagement)
And here’s the reason why: different platforms describe the same behaviors differently, and different dashboards roll up metrics into seemingly similar but not actually equivalent groups.
This platform calls them engagements, this platform calls them interactions, and this platform differentiates clicks, reactions, and more.
To track by hand, you are essentially translating the language of each platform into a single equivalent definition you can stand behind, which is exactly what you need when you compare posts, weeks, or partners.
For manual calculations, I recommend splitting out a baseline set from a fuller set.
The baseline should be the broadly public signals that are available everywhere and are hard to misunderstand: likes and comments.
That will give you a consistent metric that you can compare between accounts and over time, without running into data access issues.
If you have full analytics access (your own account, or an influencer sharing screenshots), then you can expand out to also include shares, saves, link clicks, and profile actions (profile visits, website button taps, call button taps, directions) and DMs or replies when they’re available.
In my audits, I use saves and shares as a weighted gold currency (they’re generally correlated with intent and distribution), but only if I can pull them consistently for each post in the dataset.
Further, you have to distinguish between public and private because those data points inform how you can compute when analyzing a competitor or influencer.
Public data points are typically likes and comments and occasionally views.
Private data points require analytics and include reach, impressions, saves, shares, link clicks, profile actions, and any messaging-based interaction.
So if you are benchmarking a competitor, you can still calculate a reliable public-only engagement rate that includes likes plus comments as your numerator, but you cannot claim you are measuring the full business impact of the content without those private interactions.
Your best move is to label your metric as honestly as possible in your spreadsheet so you never compare a public-only rate with an owner analytics rate and draw the wrong conclusion. If you’re struggling with repeatability, inconsistent social media posting is often the real culprit behind messy datasets.
Lastly, be aware of platform-specific gotchas that silently torpedo your manual metrics.
- A view should not be counted alongside an engagement in the same numerator unless you have defined a view as an engagement for your metric, since a view is typically non-intentional, and since views are counted differently on various platforms.
- Be aware of reactions and likes, since sometimes reactions are the like family and should be summed, but sometimes they are reported as distinct items, depending on the granularity of the data you are reading.
- When you see any metric such as other clicks or total interactions, pause and check what is in it, since it is easy to double-count when a platform reports a total and then also reports the constituent actions underneath.
Choose the right denominator (followers vs reach vs impressions)
The most common question I see on this topic is how to manually calculate engagement rate and whether you should divide by followers, reach, or impressions.
When you are doing manual calculation of engagement rate, the denominator is not a technicality, it is what the metric means.
You need to first decide what question you are trying to answer, then choose the denominator that makes the most sense for that question.
If you are trying to evaluate account health, community health, or trying to compare influencers, but you do not have access to reach, use followers-based engagement rate: total engagements/followers * 100.
This is the best choice for small businesses who are doing public benchmarking, because followers is a public, transparent, and easily auditable metric, but it assumes that followers are the audience that had a chance to see the post, which is very often not the case on algorithmic feeds.
If your question is did the content work for the people who actually viewed it, use reach-based engagement rate: total engagements divided by reach times 100.
This is the cleanest way to judge creative, hooks, and relevance because it normalizes for distribution and removes the noise of account size.
It is also the number I trust most when I am iterating on a content format week over week, because a post reaching 600 people with 60 engagements at 10 percent tells a very different story than a post reaching 6,000 people with 120 engagements at 2 percent.
The catch is you can only defend reach-based ER when you can pull reach consistently for every post you are evaluating, and you must call out that reach is platform-defined and can change based on how the platform deduplicates viewers.
If you’re in an impression-based reporting ecosystem, go with an impressions-based engagement rate (engagement/impressions * 100).
It’s often more appropriate for high-frequency delivery campaigns - when the same individual will see it multiple times - because impressions-based ER tells you a different story: how much engagement you get per impression, not per person.
The benefit is that it’s far more intuitive to paid reporting and campaign pacing, and it won’t skew upward because of a saturation point in reach.
The drawback is that the rate will be watered down by high frequency even if the content is good, so you’ll have to be prepared to explain a declining impressions-based ER by pointing out that you’ve either bought or earned more repeat impressions, not that the creative is suddenly bad. For extra context, Rival IQ’s definition and benchmarks in their rewritten title “industry benchmark report with median engagement rates” can help validate your math, since their report defines ER as total interactions divided by total follower count in the 2024 benchmark report, which also notes all-industry TikTok median engagement rate reported as 2.63%.
The key to avoiding flawed comparison is to know what NOT to compare.
You can’t compare a reach-based rate to a followers-based rate and attribute the difference to performance, because they measure different things.
You can’t compare across platforms unless you normalize both the numerator and the denominator, because if one platform counts every appearance of your ad as an impression and another counts only unique viewers, your rate will appear higher or lower for reasons that have nothing to do with the ad.
When I’m reporting, I support the denominator by putting the question I’m answering above the metric, and keeping it the same throughout the data set: followers-based for public benchmarking and community health when reach is not available, reach-based for post effectiveness among those who actually saw it, and impression-based for exposure-driven campaigns where impressions are the agreed-upon currency. If you want this to run smoothly month after month, a social media content calendar helps you keep the dataset clean and comparable.
How to calculate engagement rate for a single post
If you want to figure out the engagement rate of just one post, you can do it like this:
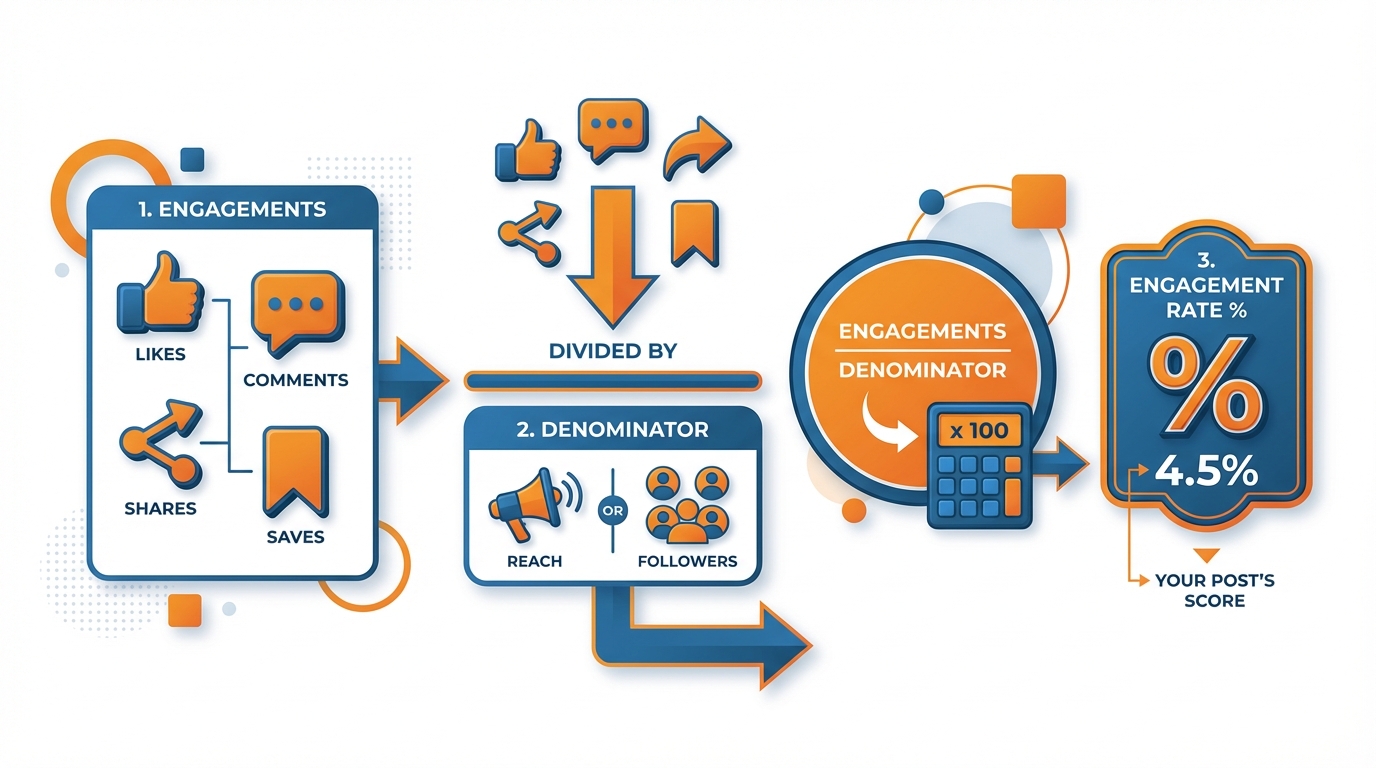
To figure out the engagement rate of a single post, you are ALWAYS doing the same thing: dividing the engagements you have decided to include by the denominator you have decided to use, then multiplying by 100 to make it a percentage.
Think about it: total engagements divided by your denominator, times 100. That’s it.
The thing to be mindful of isn’t the formula, it’s the discipline: you have to keep the same numerator and denominator every time you calculate or your percentage isn’t apples to apples from week to week and post to post.
The first formula is for the public-only calculation you can do when you are looking at a competitor, partner, or influencer using just the metrics that are publicly available.
In most cases this means likes and comments, divided by followers, times 100.
Example: I pull a post with 184 likes and 23 comments on an account with 5,200 followers.
Step 1: engagements = 184 + 23 = 207.
Step 2: divide by followers = 207 ÷ 5,200 = 0.0398077.
Step 3: multiply by 100 = 3.98077 percent engagement rate.
If the platform also shows public shares or public views and you want to include them, you can, but you must lock that decision in and apply it to every post in your comparison set or you will end up accidentally rewarding posts that simply expose more public metrics.
Next, the owner or analyst manual calculation, which is what you do when you have insights access and want a number that reflects real interaction intent.
In words: likes + comments + saves + shares + clicks divided by reach or impressions, times 100.
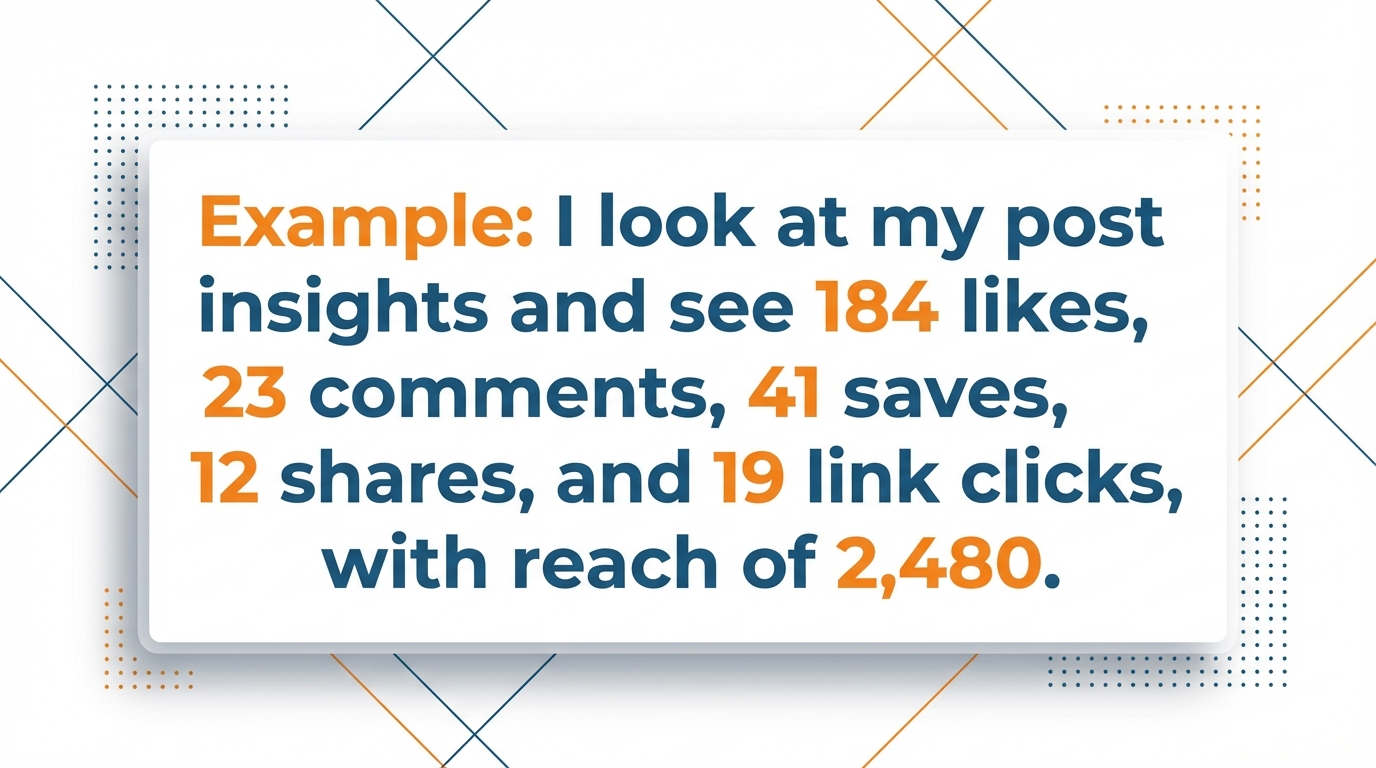
Example: I look at my post insights and see 184 likes, 23 comments, 41 saves, 12 shares, and 19 link clicks, with reach of 2,480.
Step 1: engagements = 184 + 23 + 41 + 12 + 19 = 279.
Step 2: divide by reach = 279 ÷ 2,480 = 0.1125.
Step 3: multiply by 100 = 11.25 percent engagement rate by reach.
Notice how this can be dramatically higher than the public-only follower-based rate, not because the post magically improved, but because you are measuring interaction per person reached and you are counting intent-heavy actions like saves, shares, and clicks that outsiders cannot see.
Decide on a rounding and consistency convention and stick to it so that your reporting doesn’t rock all over the place:
I suggest leaving the numbers at full granularity in your spreadsheet, but showing one decimal place for ease of reading, so 3.98077 shows up as 4.0 percent and 11.25 shows up as 11.3 percent and you always round the percentage, not the intermediate numbers.
And most importantly, if you want apples-to-apples comparability, never double down: if you’re changing from likes plus comments to likes plus comments plus saves, don’t also change from followers to reach, because you won’t know which shift is causing the variation.
Consistent numerator plus consistent denominator is what makes manual engagement rate a durable KPI over time.
Why averaging your engagement rate doesn’t work
One post is just that. One post.
When we talk about 30 days of content, we need something that we can do over and over and over.
For 30 days of content, we need to pick one denominator for all posts (followers, reach, or impressions) and one set of engagement metrics (maybe just likes+comments, or maybe likes+comments+saves+shares+clicks).
We then need a simple table where one row equals one post and we record the following columns each time: date, post type, denominator value, likes, comments, [saves, shares, clicks], total engagement, engagement rate (total engagement ÷ denominator × 100). If you want the workflow to be easier to maintain, you can also follow a weekly social media system to keep collection consistent.
If you can do this every time, you can easily calculate the engagement rate by hand across 10, 30, or 100 posts and still get back to the original post level data if someone questions you.
Most reports fall apart at the roll-up.
The average of per-post engagement rates is exactly what it sounds like: add the engagement rate of each post and divide by the number of posts.
That’s useful if you want to evaluate your typical post quality and not let one viral post skew the results, like when you’re testing a new format and you want to know whether the average post is improving week over week.
But it tricks you when your distribution changes, because a post with reach of 300 and an ER by reach of 12 percent gets the same weight as a post with reach of 30,000 and an ER by reach of 2 percent, even though the second post drove far more total business exposure.
If you need a truthful number for a timeframe, calculate a weighted engagement rate: total engagements in the timeframe ÷ total denominator in the timeframe × 100.
This is the truest way to calculate what my content delivered per unit of distribution, because it naturally factors in the content that was actually seen.
I use this when I need an accurate monthly KPI for a small business, because it mirrors how the algorithm distributes content: inconsistently.
For instance, if I had two posts with Post A at 60 engagements on 500 reach (12 percent), and Post B at 400 engagements on 20,000 reach (2 percent), then the average is 7 percent, but the weighted ER is (60+400) ÷ (500+20,000) = 460 ÷ 20,500 = 2.24 percent.
That 2.24 percent is the experience your audience truly saw at scale. For more context when comparing results to “normal,” the rewritten title “key takeaways from an industry benchmark report” summarizes benchmark figures like TikTok median engagement rate: 5.69% in the Rival IQ key takeaways.
Common pitfalls that break manual engagement reporting
The quickest way to mess up a batch of calculations is with tiny, hidden errors that add up, like not normalizing percentages if you have reach and impressions discrepancies, using mixed denominators in a single report (reach for some posts, followers for others), using mixed numerators (saves on some posts but not others), and using apples-to-apples posts with different amplification modes (paid, boosted, collab, viral).
The easiest way to ensure accurate reporting is to include the actual formula in your metric title, and use the same title every time you report the same metric.
I.e. ER by Reach likes+comments+saves+shares.
That simple title helps disambiguate later, and ensures you do not make a manual calculation error when calculating the same metric for multiple posts. If you want an additional real-world example of reported engagement-rate figures, an academic-style paper titled a comparative analysis of Instagram and TikTok as Da'wah media reports engagement rate on TikTok: 1.42% and engagement rate on Instagram: 5.47% for the observed account/period.
Conclusão
What is the simple math to calculate engagement rate?
Simply this: decide what you consider engagement, choose your denominator based on your objective, apply consistently, and dodge the average that makes a thousand-followers post equal to a 1 million followers post.
Now make it useful: choose one house metric per reporting situation and treat it like an accounting standard.
For an external audit (competitors, influencers, partners), that should remain an externally viable metric (generally likes + comments) / followers, which you would be clear is a public-facing metric.
For internal reporting, your denominator should always be reach or impressions, and your numerator should include every action you have access to (including the high intent signals of saves, shares, and clicks, when possible) because that’s what measures whether your content delivered for the people who viewed it.
This is where small businesses outshine those loud voices: once you make your math repeatable, then your metrics are comparable, and once comparable, you can make a move on them.
If your numerator and denominator are the same for a quarter, you know that a 1pt uptick in engagement rate per reach is real, because it is averaged over dozens of posts, not one outlier.
Every time I have to change the numerator and denominator, I consider it a new metric, because otherwise you are dancing about metrics, not success.
So here is what I want you to do if you do nothing else: decide on a formula and enter it into a spreadsheet at the top.
Then DO NOT mess with it “just this once” because a post performed really well or really badly.
That one little discipline will keep your engagement reporting “audit-proof”, your month-to-month trends meaningful, and your metrics comparable as you assess your content, your offers, and your distribution channel.
Related reads
4/27/2026
B2B SaaS social media benchmarks: Set the right targets.
B2B SaaS social media benchmarks: Set the right targets. The trouble with defining B2B SaaS social media benchmarks is that it's an inherently impe...
4/25/2026
Building a personal brand as a technical founder (without becoming a creator)
Building a personal brand as a technical founder (without becoming a creator) Creating a personal brand as a tech founder should feel less about ma...
4/20/2026
Creative Post Ideas for Sustainable Brands (That Don’t Sound Greenwashy)
Creative Post Ideas for Sustainable Brands (That Don’t Sound Greenwashy) That’s not what creative post ideas for sustainable brands should look lik...